|
Q: What is the tungsten halogen and Deuterium lamp's
working range?
A: Tungsten halogen for visible range is from 340nm
to 1100nm, Deuterium lamp for UV range starting from
190nm to 339nm.
Q: How long can Tungsten Halogen lamp and Deuterium
lamp works?
A: Tungsten Halogen lamp can work 1,000 hours.
Deuterium lamp for Azzota SpectroExpress and SpectroMaster
series can work 2,000 hours.
Go to Top
Q: From 200 to 339 nm, machine failed the zero and
100%T reading when even with water or empty cuvette,
why?
A: The light beam at 200-339 nm can not pass the glass
cuvette. Make sure use quartz cuvette. If use quartz
cuvette, still have problem, the D2 Lamp needs to be
changed or adjusted. If still fail after changed and
adjusted lamp, Please contact AZZOTA technical support.
Go to Top
Q: Height of a light beam for adapting cuvettes
from different manufacturers?
A: Different manufacturer's Z height is different. Azzota's
Spectrophotometer is 15mm.
Go to Top
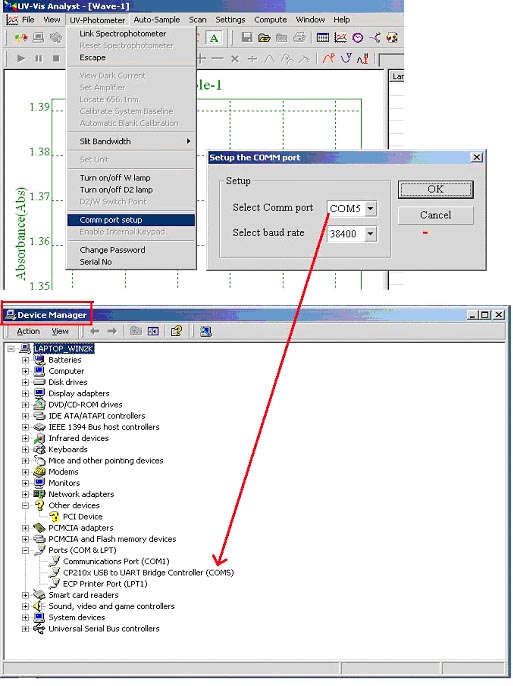
Q: Why my software does not work?
A: Please do following first:
1) Change dongle USB port
2) Change USB cable
3) Restart spectrophotometer and computer
4) Open the software, choose the right COM port. you can find the right COM port from Windows' Device Manager" (see following picture). After choose the right COM port, close the software
4) Open the software again, the machine should be controlled by software
5) If still
has problem, remove the software and re-install it
Go to Top
Q: What is the function of M.Wave Basic software?
1) Single wavelength photometric measurement
- 2 methods to set up the regression curve. Up to 20 standards to set up the regression curve. The M.Wave Basic will calculate the working curve using a linear equation that fits the data. Enter factor values to generate regression curve.
- 2 methods for curve fit: Linear fit and Quadratic fit.
2) Kinetics
- Allow user to set scan Interval (0.5, 1.0, 2.0, 5.0, 10.0, 30.0 and 60.0s).
- Spectrum display mode can be changed (Time-100%Trans. or Time-Abs.)
Working on model: SV1200, SV1600, SV1800, SM1100, SM1200, SM1600 and SM1800
Go to Top
Q: What is the function of M.Wave Professional software?
Quantitative Analysis
Coefficient Method to establish a Standard Curve
Create a curve by standard samples
Kinetics
You can choose the Time Intervals (0.5, 1.0, 2.0, 5.0, 10.0, 30.0 or 60.0 Seconds).
You can choose different Photometric Mode to display the curve. (Transmittance-Time & Absorbance-Time)
Wavelength Scan
You can save and load the System Base Line.
You can choose the Scan Intervals (0.1, 0.2, 0.5, 1.0, 2.0 and 5.0nm).
You can choose the Photometric Mode to display the spectrum. (Wavelength-Transmittance, Wavelength-Absorbance or Wavelength-Energy)
Automatically list spectrum peaks.
Spectrum process(+,-,*,/,derivative and smooth)
Multi-wavelength Test
You can set at most 20 wavelengths to measure a sample.
DNA/Protein Test
Two methods are under your choice.
You can input the coefficients by yourself.
Working on model: SV1200, SV1600, SV1800, SM1100, SM1200, SM1600 and SM1800
Go to Top
Q: What is the function of UV-Vis Analyst software?
1) Single wavelength photometric measurement
Go to a desired wavelength quickly and conveniently.
Photometric value display mode can be changed (%Transmittance or Absorbance).
2) Fixed Points Measurement, Multi-wavelength Photometric Measurement
Up to 20 wavelength points can be set up.
Results will be grouped into a table format automatically.
3) Concentration Measurement
2 methods to set up the regression curve. Up to 20 standards to set up the regression curve. The UV-Vis Analyst will calculate the working curve using a linear equation that fits the data. Enter factor values to generate regression curve.
3 methods for curve fit: Linear fit, Quadratic fit and Cubic fit.
4) Wavelength Scanning
Allow user to set scan step (0.1, 0.2, 0.5, 1.0 and 5.0nm).
Spectrum display mode can be changed (Wavelength-%Transmittance or Wavelength-Absorbance).
Peaks and valleys will be automatically detected after scanning (User can define the peak threshold).
Powerful spectrum processing functions are provided.
5) Time Scanning
Allow user to set scan Interval (0.5, 1.0, 2.0, 5.0, 10, 30 and 60s).
Spectrum display mode can be changed (Time-%Transmittance or Time-Absorbance).
Peaks and valleys will be automatically detected after scanning (User can define the peak threshold).
Powerful spectrum processing functions are provided.
6) DNA/Protein Measurement
Wavelength points and ratios can be set up.
Results will be grouped into a table format automatically.
Working on model: SE3000 and SE6000 series
Go to Top
Have question? Please contact
us now! |